First look at the Azure SQL Managed Instance MP
The Azure SQL Managed Instance is one of Microsoft’s Platform-as-a-Service (PaaS) offerings for SQL. It adds all the features you would expect of a PaaS platform such as automated patching, backups and streamlined high availability whilst closely aligning the technology to on-premises or IaaS workloads to reduce the barrier to entry. The product features near 100% compatibility with the latest Enterprise Edition of SQL Server and the automated Azure Data Migration service. As a result, the product is an attractive option for those looking to lift and shift their existing enterprise applications and commercial-off-the-shelf (COTS) products into the new PaaS world.
Naturally, many of these organizations are going to be using SCOM to monitor their estates and workloads using traditional on-premises or Infrastructure-as-a-Service (IaaS) workflows. Some components of these applications may not currently suit a PaaS architecture and need to retain their current form once the SQL workflows have moved. Therefore they will stay squarely within SCOMs remit.
The managed instance management pack aims to close the gap that the traditional SQL management packs would have filled before the migration to PaaS. The management pack utilizes T-SQL queries to monitor the DB Engine, Databases, Agents, Jobs, Memory-Optimised Data, and Failover Groups allowing a wide variety of monitoring scenarios to be covered. Crucially it will allow for the whole application to continue to be monitored in its totality.
Setting up the MP
Like the previous version of the management pack one of the ways of monitoring your instances is to manually provide a public or private connection string and the credentials to use it. These are very easy to obtain via the connection strings menu of the Managed Instance itself in the Azure portal. If you don’t have a Gateway or VPN to the network you can use a public connection string, however, this needs to be enabled in the MI Virtual network menu and may require some network security group configuration. My lab environment is entirely situated within Azure so I was able to limit this down to purely Azure resources on setup and then down to only my resources soon after that. For my lab environment this is fine, your organisational requirements may preclude this. In general this is a pretty straightforward no-frills discovery tool and isn’t very dynamic. Which brings me on to my personal big ticket feature of the latest version of the Azure Managed Instance Management Pack. It can provide automatic discovery by leveraging Enterprise Applications and the Azure Active Directory Graph API to discover and monitor your instances. No manual connections required!
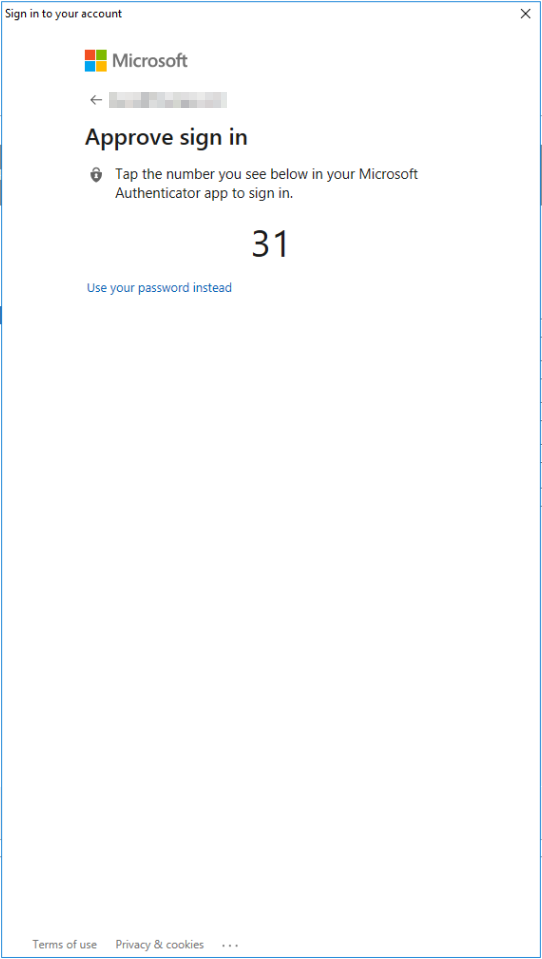
If going down this route you’ll need an SPN for your monitoring. You can configure this manually or if you have an account with the permissions required to create an Enterprise application you can go down the auto-creation route. For auto-creation You’ll need to be able to sign in to Azure Active Directory from the console, and this can utilise all of the latest Multi-factor Authentication methods including passwordless authentication:
Once authenticated you will get an enterprise application generated and the details returned to you for your records. The application name is especially useful for later. The other important details will make their way into the Run As account generated for this purpose (which is then distributed to the new MI monitoring resource pool).
You’ll then select your subscriptions and how you want to authenticate:
SQL credentials are a fairly traditional method of monitoring your SQL instances, but AAD allows you to monitor using the previously generated application. More on this later. Finally you get the ability to set some filters for what you do and do not want to discover.
The discoveries have all the exclusion lists and filters that we have come to expect from an SQL management pack, allowing you to quickly narrow the focus to just the databases or instances that your teams care about.
From the SCOM side of things you should now be ready to watch the instance seeds roll in (Get-SCOMClass -Name Microsoft.Azure.ManagedInstance.DBEngineSeed | Get-SCOMClassInstance). However, if you are fully going down the AAD route there are still some steps to complete the loop in Azure. Remember that application name you noted down earlier? You’ll need to make sure that the Enterprise Application has consent to use the APIs that it requires:
Similarly the managed instances themselves will need to allow the Enterprise Application permission to monitor.
USE [master];
CREATE LOGIN [Azure_SQL_ManagedInstance_App_xxxxxxxx-xxxx-xxxx-xxxx-xxxxxxxxxxxx] FROM EXTERNAL PROVIDER;
ALTER SERVER ROLE [sysadmin] ADD MEMBER [Azure_SQL_ManagedInstance_App_ xxxxxxxx-xxxx-xxxx-xxxx-xxxxxxxxxxxx];
I personally had a jumpbox configured to grant access to the instance, however, there are more automated solutions out there that can be built into more mature deployment procedures (such as DevOps pipelines). There are lower privilege monitoring scenarios described in the MP guide itself, so please do check that out if this is a requirement for you.
The Monitoring in the MP
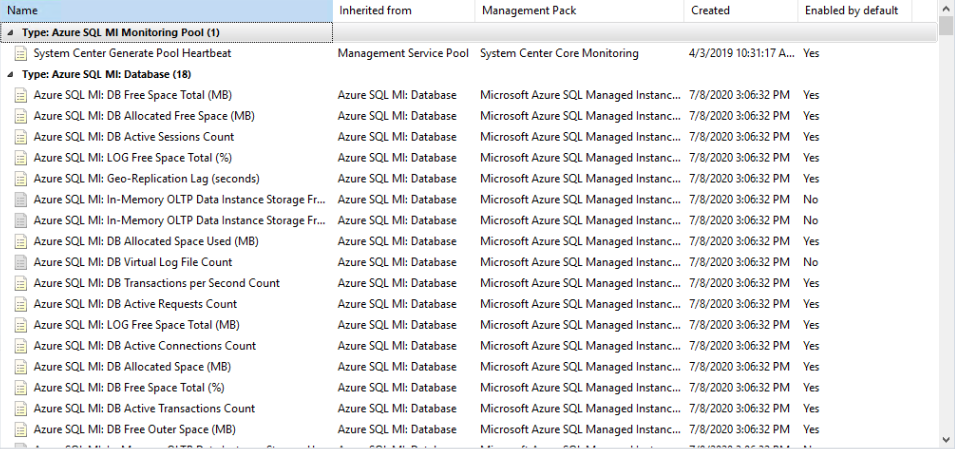
Initially, it looks like the management pack is well thought out. Whilst there are fewer monitors than it’s on-premises counterpart it’s important to bear in mind that there are fewer configuration and monitoring scenarios with the managed instances anyway. Gone are Availability groups and infrastructure specific monitors such as service monitors and version compliance. In the PaaS world you get a lot of that included in the package.
From the rules side of things, we see a similar picture.
A slight dip in the number of rules but still a large number of performance metrics collected and a number of alerting rules. Similar to the monitors there are scenarios and metrics that are managed for you in the PaaS world, however, you will still maintain visibility over the KPIs and get event-driven alerts for things that are still under your control.
Much like other SQL packs, there are a decent set of groups for quick out of the box scoping:
There are some nice touches with Azure specifics such as Geo-Replication status of your databases and plenty of performance metrics to allow your capacity management processes room to identify excesses or expansion requirements. Otherwise you will see a lot of what you are used to from the modern SQL management packs! If I were being fussy I would say that I’m a touch disappointed that the full resource ID is not discovered for use with the AZ module and enabling direct linking to the Azure portal (https://portal.azure.com/#@domain.tld/$ID). The former still works, but does require a little bit of fussing with subscription contexts. This is me being fussy though and you could easily loop through them all and add them to the instances (often unused) notes property if this does matter to you as well.
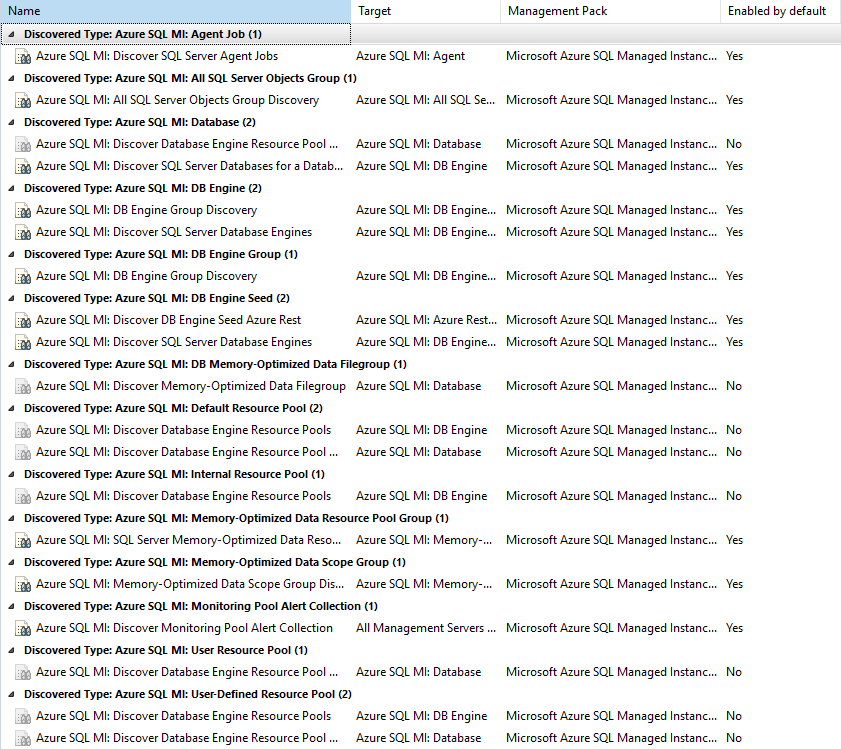
Out of the box you’ll get your seeds, engines, agents, agent jobs, databases and memory optimised data groups discovered (if you are using them). It can be worth lowering the interval on your seed and database engine discoveries to keep objects flowing in as you start getting things tested out. Managed instances are expected to take up to 6 hours to deploy out, but for the most part I find they are done within 3 (in one fluke instance it took 2 and a half days, but this is very much an outlier!).
If you are planning to setup this MP for the first time, we recommend you disable everything apart from Discoveries initially (globally!) - yes, that means no monitoring but hear me out. Doing this will prevent you from sending unactionable alerts to the people who will end up consuming them and gives you time to work with the domain experts to turn on only required monitoring.
Cookdown’s Easy Tune allows you to globally disable everything in a few clicks, and its free – get it here.
A tuning pack for the new managed instance MP in the community store will be coming soon.
The PRO version of Easy Tune includes other bells and whistles like the ability to apply different tuning at different times of the day/days of the week, capture your current effective tuning from a group/object for applying elsewhere (great for applying tuning you like elsewhere or for Management Group side by side upgrades) and a PowerShell SDK for automating alert tuning. You can check it out here.
If you are using ServiceNow as your ITSM tool, Cookdown has you covered for incident generation and CMDB population using our ServiceNow connector as well. Allowing you to break the cycle of email alerts getting filtered off into folders and an incomplete CMDB leaving you with costly resources that may have been forgotten about.


