SCOM event collection causing the Data Warehouse to grow rapidly
I've encountered an interesting issue while working for one of my customers that are using SCOM 2016 to monitor their infrastructure. The SCOM data warehouse was growing rapidly each week and there was clearly something off.
Introduction
There are a lot of things that may happen in a SCOM environment, one of the most common things would be alert floods. Another thing that may occur often is the growth of the SCOM database and data warehouse.
When it comes to the SCOM data warehouse growth, one of the first things that might come to mind is the collection of raw performance data, so this would probably be the first thing we check.
But what if it isn't the performance data? Well SCOM does a lot of event collection, this is something we might not actually pay too much attention to. It is, however, a very important thing to be checking every now and then, because we all know Windows does log a massive amount of events in the Windows event logs, and SCOM has a lot of rules enabled for collecting various different Windows events.
The Case
I was working with a customer who was using SCOM 2016 with the latest Update Rollup 8 (as of writing this post) installed, and they have around one thousand agents being monitored.
I was contacted by one of the DBAs asking if we (the SCOM administrators) are performing anything heavy on the SCOM databases, as they were growing on disk space rapidly. The DBAs provided me with statistics showing that the SCOM data warehouse was growing with roughly 100GB every week, that is a lot!
I got very concerned so I started by checking the disk space usage of the SCOM database and data warehouse and the results were shocking! The SCOM data warehouse was over 700GB big, which was not normal.
The DBAs then provided me with an interesting trend for the disk usage of the SCOM data warehouse as shown below:
As they say, a picture says more than a thousand words, well here we can clearly see that something's not right, if the SCOM data warehouse is growing this much at this pace, we will be out of storage within a few months!
The Troubleshooting
I started troubleshooting as soon as I've heard the news from the DBAs, I started by connecting to the SCOM database and data warehouse remotely with the SQL Server Management Studio.
I then ran the following SQL query on the SCOM data warehouse:
[SQL]
SELECT convert(decimal(12,0),round(sf.size/128.000,2)) AS 'FileSize(MB)',
convert(decimal(12,0),round(fileproperty(sf.name,'SpaceUsed')/128.000,2)) AS 'SpaceUsed(MB)',
convert(decimal(12,0),round((sf.size-fileproperty(sf.name,'SpaceUsed'))/128.000,2)) AS 'FreeSpace(MB)',
CASE smf.is_percent_growth WHEN 1 THEN CONVERT(VARCHAR(10),smf.growth) +' %' ELSE convert(VARCHAR(10),smf.growth/128) +' MB' END AS 'AutoGrow',
convert(decimal(12,0),round(sf.maxsize/128.000,2)) AS 'AutoGrowthMB(MAX)',
left(sf.NAME,15) AS 'NAME',
left(sf.FILENAME,120) AS 'PATH',
sf.FILEID
from dbo.sysfiles sf
JOIN sys.master_files smf on smf.physical_name = sf.filename[/sql]
The above SQL query will show the DB and log file size and the used/free space, this SQL query can be run on both the SCOM database and data warehouse.
After running this query I saw that the file size of the OperationsManagerDW.mdf was 713GB big...
Next, I wanted to know what's using so much disk space within the SCOM data warehouse, I ran the following SQL query on the SCOM data warehouse:
[sql]
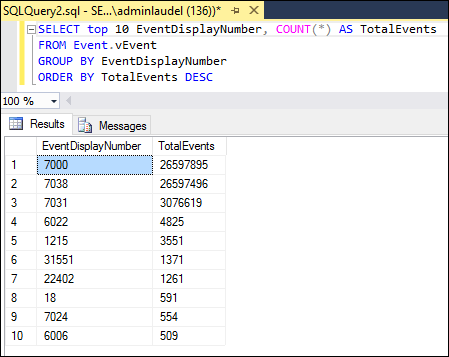
SELECT top 10 EventDisplayNumber, COUNT(*) AS TotalEvents
FROM Event.vEvent
GROUP BY EventDisplayNumber
ORDER BY TotalEvents DESC[/sql]
The result was the following:
We can see that we have over 26 million! events of the event ID 7000 and 7038, and over 300k events of event ID 7031.
So, what are the event 7000, 7031 and 7038? We can check this by running the following SQL query on the SCOM data warehouse:
[sql]SELECT top 10 Number as EventID, COUNT(*) AS TotalEvents, Publishername as EventSource
FROM EventAllView eav with (nolock)
GROUP BY Number, Publishername
ORDER BY TotalEvents DESC[/sql]
This is the result we got:
So the top three events are coming from the Service Control Manager shortened for “SCM”.
So what is the SCM?
It is a special process under the Windows NT family of operating systems that starts and stops Windows processes, including device drivers and startup programs. Its main function is to start all the required services at system startup.
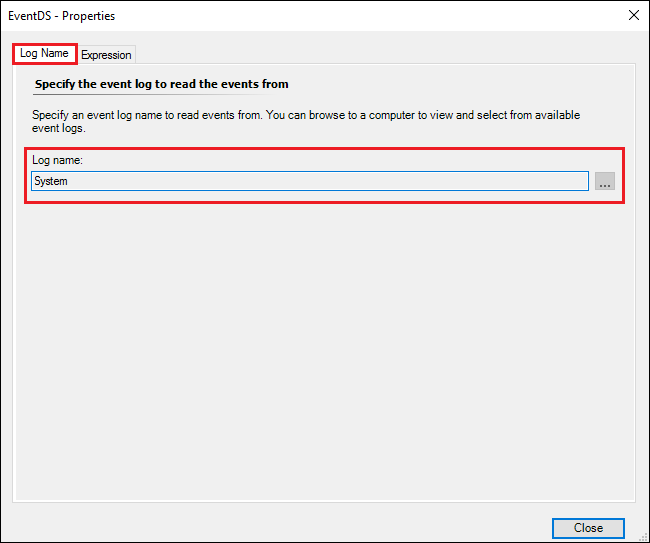
Now we need to identify which rules in SCOM are collecting these Service Control Manager events. To do so I created an Event View, but since there were millions of events I will create the view for only the last day so we don’t get too many events, because we only want to identify which rule is collecting these events
And this is the result after collecting events from the last 3 days:
So now all we have to do is to select one of these events to find out which rule is collecting these events.
We’ve now finally found the rule, to be 100% sure this is the rule, we checked the properties of the rule itself.
As we can see from the images above the rule does match some of the events we’ve received.
The Solution
Before proceeding with a meeting we should always check with the customer if these events provide any relevant information or not. Many of these events are irrelevant for most and can thus be disabled.
Another very important thing to check with the customer is the retention periods of the raw data we collect in SCOM. After a deeper discussion with the customer, they decided to lower down the retention for the event data to 30 days instead of 100 as this is sufficient for them.
To solve the issue of massive event collections, overrides were created to disable the event collector rules for the events 7000, 7031, and 7038.
Example: Disabling an event collection rule the event collection rule
1. Right-click the Rule, click on Overrides, select Override the Rule, and finally select For all objects of class: Windows Server 20XX Operating System.
2. Check the Override check box for the Enabled parameter, and then change the Override Value to False, select a destination management pack and then click OK to apply the override.
The Aftermath
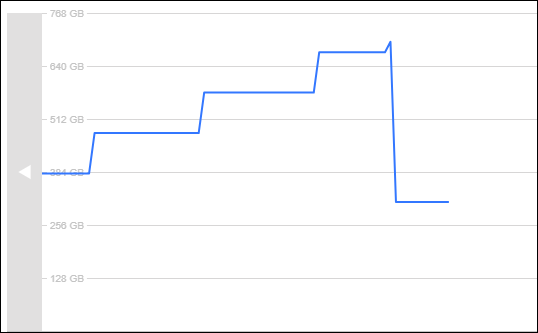
After 30 days had passed we started seeing a massive improvement in the SCOM data warehouse disk usage, this is also because of the retention period that was lowered from 100 to 30 days.
To give a better picture of this, the visual graph below clearly shows the disk usage has gone down by a lot:
I strongly recommend checking for the top collected events periodically, in large environments there can be tons of events that could be avoided from consuming unnecessary disk space!


